
Case Study
Medical Device Failed EMC Testing: How We Fixed It and Passed IEC 60601-1-2
A motorised benchtop instrument failed pre-compliance radiated emission at a single frequency. NexorTest localised it to one motor driver and the cables running off it, then showed which fixes move the number and which do not.
- Client
- Medical device OEM, undisclosed
- Device class
- Multi-axis motorised benchtop instrument
- Scope
- Radiated emission root cause and design review
- Engagement
- 2026, four weeks
The Device
Why this class of product radiates
The instrument runs three motor axes from a single control board, fed by a mains-input switching supply. Sensors, indicators and a display module each sit at the end of their own unshielded harness. Ten separate cable runs leave the board.
Switching sources mapped before any measurement
Before touching the hardware, every switching source in the bill of materials was catalogued so that measured peaks could be matched to candidate origins. Without that map, a peak at 400 MHz is just a number on a screen.
| Source | Frequency band | Relevance |
|---|---|---|
| Microcontroller core clock | tens of MHz | Harmonics across the VHF range |
| Motor driver internal clock | ~10 MHz | Harmonics and mixing products into UHF |
| Motor driver chopper | tens of kHz | Broadband current on motor harnesses |
| Motor driver PWM | tens of kHz | Broadband current on motor harnesses |
| Serial bus to the display and indicators | 100 to 400 kHz | Edge rate, not clock rate, is the driver |
The Problem
A failure with no headroom around it
The client arrived with a pre-compliance radiated emission report from an external lab. One frequency failed. The more serious issue was the shape of the result either side of it: seven of the ten recorded peaks sat inside a 15 MHz band, and the passing ones passed by 2.5 to 4.8 dB.
| Frequency (MHz) | QP (dBµV/m) | Limit | Margin (dB) | Result |
|---|---|---|---|---|
| 61.6 | 36.4 | 40 | 3.6 | Pass |
| 102.5 | 36.6 | 40 | 3.4 | Pass |
| 103.8 | 37.5 | 40 | 2.5 | Pass |
| 388.4 | 42.8 | 47 | 4.2 | Pass |
| 392.2 | 42.4 | 47 | 4.6 | Pass |
| 392.8 | 42.5 | 47 | 4.5 | Pass |
| 396.1 | 43.8 | 47 | 3.2 | Pass |
| 397.0 | 42.2 | 47 | 4.8 | Pass |
| 400.0 | 49.0 | 47 | −2.0 | Fail |
| 403.8 | 44.5 | 47 | 2.5 | Pass |
Fixing only the peak that failed would have left the product a unit-to-unit variation away from failing again.
The no-load run told the same story. With the motors idle, the highest peak was 45.5 dBµV/m at 400 MHz, 1.5 dB under the limit. The mechanism was present whether or not the machine was moving.
Approach
Four measurements, each answering one question
An accredited chamber is a measurement facility, not a debug facility. The failure was reproduced in-house and narrowed in four stages, each eliminating a class of cause before the next began.
1. Design review: what is capable of producing this?
Schematics, PCB files, bill of materials and component datasheets were reviewed against the frequency map. Beyond the specific failure, the review flagged the design gaps that make any board of this type more likely to radiate:
- No ferrite bead and no transient suppression at the DC input connector.
- Missing local decoupling at the motor driver ICs.
- Missing pull-up and pull-down terminations on driver control lines and on the serial bus.
- No debug test points on the reference rails, so nothing could be probed without modifying the board.
- Two sub-assemblies supplied without design documentation, so they could not be assessed at all.
2. TEM cell: is the energy escaping through the enclosure or the cables?
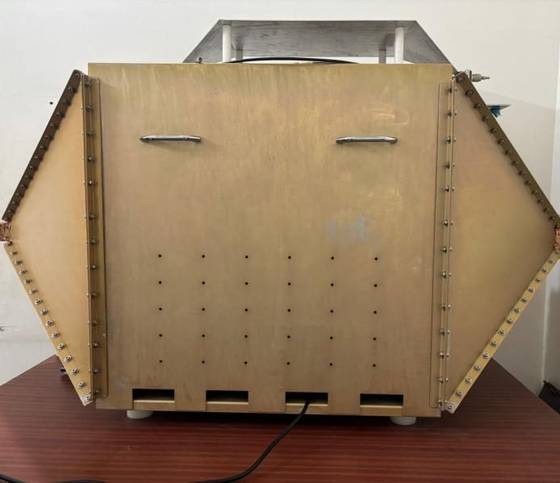
The unit was swept in a TEM cell from 20 MHz to 500 MHz, first with the enclosure closed, then open. Both runs produced the same peak structure. That pointed away from enclosure shielding as the dominant path and towards the board and its harnesses.
3. Current clamp: which cable is carrying it?
A current clamp was fitted to each harness in turn and swept from 5 MHz to 150 MHz. This separates the cables that are radiating from the ones that are merely present.
4. Near-field probe: which component is the source?
With the cables identified, a near-field probe was walked across the board around the three motor drivers. Two showed moderate activity. The third showed the strongest broadband signature and a peak at the same frequency that failed in the chamber.
Root Cause
A source on the board, an antenna outside it
The three in-house measurements converge on one mechanism. Driver C and its surrounding circuitry generate energy at around 400 MHz. That energy leaves the board as common-mode current on the motor and display harnesses. Those harnesses, unshielded and unterminated, radiate it.
This matters because it tells you where each fix will and will not work. A ferrite on a cable attenuates what the cable carries. It does nothing about what the driver circuit produces. The board-level gaps found in the design review are the ones that address the source.
The Fix
Two tracks, run in parallel
Track 1: cable-level suppression, testable the same day
Ferrite cores were fitted to the identified harnesses and each configuration re-measured with the clamp. Core selection was matched to the impedance needed in each band, and turn count was measured rather than assumed. On one motor harness, a second turn through the same core bought a further 2 dB.
Track 2: board-level changes for the next PCB revision
- Ferrite bead and transient suppression at the DC input, close to the connector.
- Local decoupling at each motor driver, plus the missing terminations.
- Decoupling and a debug test point on the level shifter reference rail.
- Pull-up on the unterminated MCU control line.
- Protection device confirmation on the DC rail.
- Design documentation requested for the undocumented sub-assemblies before the revision is released.
Measured Effect
What the ferrites moved, and what they did not
Below 150 MHz, the cable fix worked. Common-mode current dropped by roughly 6 dB broadband, and considerably more on the display cable. Several peaks disappeared entirely.
The honest part
Re-running the TEM cell sweep with cores on all three motor harnesses showed the limit of a cable-only fix. Some frequencies improved by 3 to 7 dB. Others moved the wrong way by 1 to 2 dB. At the frequency that failed, the level was unchanged.
Ferrites bought broadband margin below 150 MHz. They did not touch 400 MHz. That peak belongs to the driver and closes with the board-level changes, not with a clamp-on part.
A supplier who stops at the ferrite would have reported a 6 dB improvement and sent the client back to the chamber to fail again at the same frequency.
Outcome
Pass across the full sweep
The board-level changes were implemented on the revised PCB and the specified cable suppression fitted. The instrument went back to the accredited chamber and passed radiated emission across the entire 30 MHz to 1 GHz sweep. The 400 MHz peak that failed the first round cleared the limit, and no other frequency rose into it.
Radiated emission, 30 MHz to 1 GHz: pass at every frequency
Cleared on the first re-test after the changes, with no further design iteration.
Each half of the fix did the job it was scoped to do:
- At the source: the driver-side decoupling, input filtering and terminations removed the 400 MHz peak where it originated, which is the one thing cable suppression could never do.
- On the path: the cable cores held the broadband margin below 150 MHz, so the passing frequencies stayed passing rather than drifting up as the board changed.
- Commercially: one chamber booking, one shipment, no second failure.
Deliverables
What the client received
- Schematic and BOM review with itemised corrections by reference designator.
- Frequency map linking every switching source to the measured peaks.
- TEM cell, current clamp and near-field probe data sets, enclosure open and closed, loaded and unloaded.
- Root cause statement tied to measurement evidence rather than inference.
- Suppression components, placement per cable and verified turn counts.
- Board-level change list for the revised PCB, carried through to the passing re-test.
Why the sequence saves money
Each failed round at an accredited chamber costs a booking, a shipment and a wait. Running the localisation in-house meant walking back into the chamber once, with a fix that already had data behind it.
Facing an EMI/EMC failure or preparing for compliance testing? Nexortest Technologies can help identify the root cause and implement targeted fixes before they become costly delays.
Published with the client’s identity, device, architecture and component selection withheld. Figures are drawn from measurement data; no schematic, layout, board imagery or bill of materials content is reproduced. In-house results are indicative and are not a substitute for accredited testing.
Meet Our Regulatory Expert

Bhuvaneshkumar
Testing Expert at NexorTest Technologies
Newsletter
Sign up our newsletter to get update information, promotion or insight.